Querying an Excel File With SQL in DuckDB Step by Step
Run SQL on an Excel workbook with DuckDB: the excel extension, a pandas DataFrame route, sheet and range options, types and checks that keep numbers right.
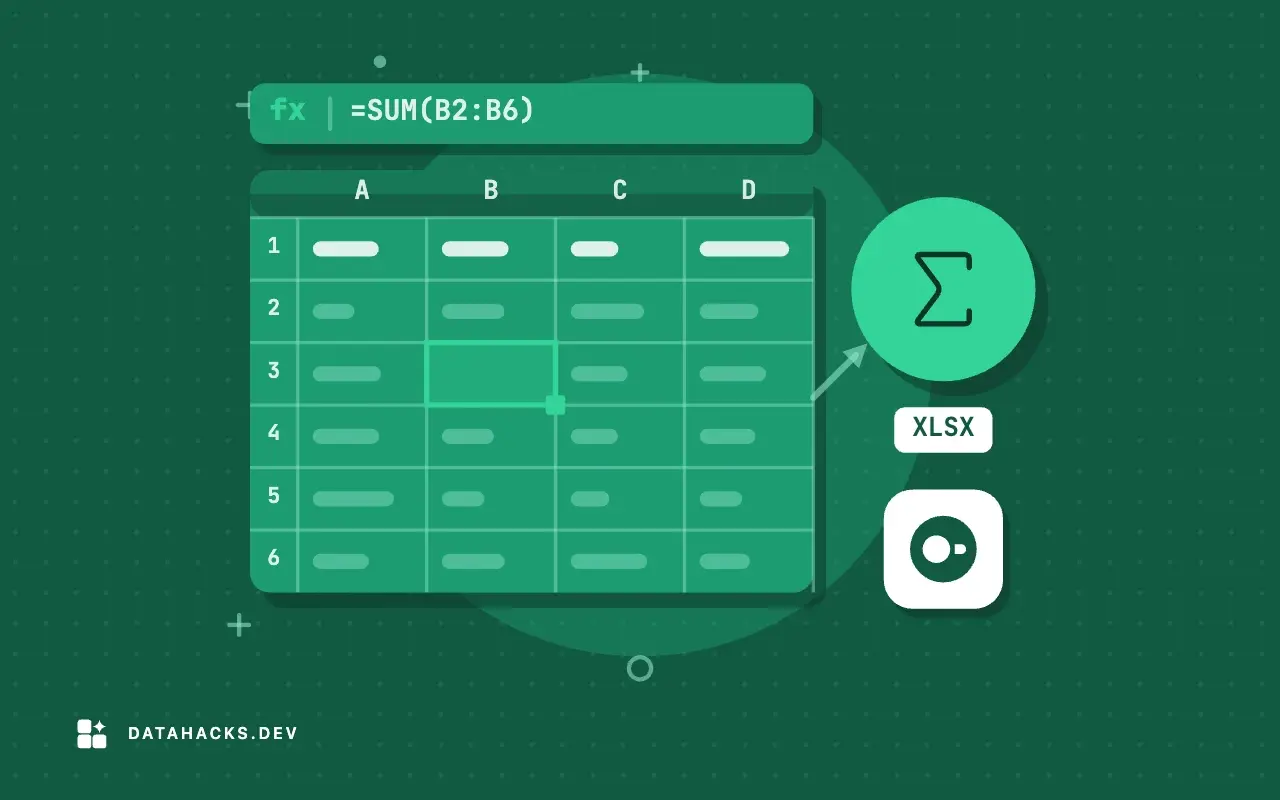
An analyst has a workbook of orders and a question that formulas answer badly: the top customers by month with a running share, or the customers who bought in March and not in April. In SQL these are a few lines. DuckDB lets you run SQL on the workbook without building a database, installing a server or importing anything. This post shows two ways to query an Excel file, how to control what DuckDB reads, how to write the result back out and how to check that the answers are the ones Excel would give. It is a spoke of doing proper analysis on Excel data with SQL.
What DuckDB is for here
DuckDB is an analytical database that runs inside your process, like SQLite, and is built for scans, aggregates and joins over columns. It reads CSV and Parquet natively, and, in recent versions, xlsx through an extension. You install it with pip install duckdb or download a single binary. There is nothing to start. For an analyst with a workbook, it means standard SQL, including window functions, common table expressions and PIVOT, applied to the sheet's data (loading Excel files with DuckDB covers loading into a persistent database).
Route 1: the excel extension
In recent releases, the excel extension adds read_xlsx:
INSTALL excel;
LOAD excel;

SELECT *
FROM read_xlsx('orders.xlsx', sheet = 'Orders')
LIMIT 5;
The function reads the named sheet (the first if you omit sheet). Options worth knowing:
| Option | Effect |
|---|---|
sheet | Sheet name to read |
header | Whether the first row is a header (true by default in many versions) |
range | A cell range such as A1:F5000, to skip a title block or a notes area |
all_varchar | Read every column as text, no type inference |
ignore_errors | Turn cells that do not fit the inferred type into nulls instead of failing |
empty_as_varchar | Treat empty columns as text |
Check the documentation for your version, as names and defaults have changed between releases.
Type inference is the point to watch. DuckDB looks at the cells and picks a type per column. A column that is all numbers becomes numeric, a column with dates in date-formatted cells becomes a date, and a column with mixed content becomes text or errors. Preview what it decided with DESCRIBE:
DESCRIBE SELECT * FROM read_xlsx('orders.xlsx', sheet = 'Orders');If a column should be text and was read as a number (an order number with leading zeros, a postal code), read everything as text and cast on purpose:
SELECT order_no,
       TRY_CAST(order_date AS DATE) AS order_date,
       TRY_CAST(amount AS DECIMAL(12,2)) AS amount
FROM read_xlsx('orders.xlsx', sheet = 'Orders', all_varchar = true);
TRY_CAST returns null for a value that does not convert, so you can count the failures:
SELECT COUNT(*) FILTER (WHERE TRY_CAST(amount AS DECIMAL(12,2)) IS NULL AND amount IS NOT NULL) AS bad_amount
FROM read_xlsx('orders.xlsx', sheet = 'Orders', all_varchar = true);
Route 2: pandas and a DataFrame
If your DuckDB version has no read_xlsx, or you need pandas' control over the read (header rows, skipped lines, per-column types), read the sheet with pandas and let DuckDB query the DataFrame by its variable name:
import duckdb
import pandas as pd

orders = pd.read_excel("orders.xlsx", sheet_name="Orders",
                       dtype={"order_no": str}, parse_dates=["order_date"])

top = duckdb.sql("""
    SELECT customer, SUM(amount) AS revenue
    FROM orders
    GROUP BY customer
    ORDER BY revenue DESC
    LIMIT 5
""").df()
print(top)
DuckDB finds the Python variable orders by name ("replacement scan") and queries it without copying. Several DataFrames can be joined the same way. This route works on any version, and it puts all the reading decisions in pandas, where they are familiar (working with Excel in pandas). It still loads the sheet into memory through pandas, so it is limited by the size of the file.
A first useful query
Given a table orders(order_no, order_date, customer, region, amount), a question that is awkward in formulas:
WITH monthly AS (
    SELECT customer,
           date_trunc('month', order_date) AS month,
           SUM(amount) AS revenue
    FROM orders
    GROUP BY customer, month
)
SELECT month, customer, revenue,
       ROUND(100.0 * revenue / SUM(revenue) OVER (PARTITION BY month), 1) AS pct_of_month,
       RANK() OVER (PARTITION BY month ORDER BY revenue DESC) AS rank_in_month
FROM monthly
QUALIFY rank_in_month <= 3
ORDER BY month, rank_in_month;
QUALIFY is DuckDB's filter on window function results, so you can keep the top three per month without a subquery. The window SUM(revenue) OVER (PARTITION BY month) gives each customer's share of the month. In a spreadsheet this takes a pivot, helper columns and a lot of care; here it is one statement you can read, rerun and keep.
Write the result
Send the answer wherever it is needed:
COPY (SELECT ... ) TO 'top_customers.csv' (HEADER);
COPY (SELECT ... ) TO 'top_customers.parquet' (FORMAT parquet);
COPY (SELECT ... ) TO 'top_customers.xlsx' (FORMAT xlsx, HEADER true);
The xlsx export is available in versions of the excel extension that support writing; otherwise write CSV and open it, or use pandas: result.df().to_excel("top_customers.xlsx", index=False). For a report with formatting, build it with openpyxl or XlsxWriter from the result (building a multi-sheet Excel report).
Check the numbers
A query on a workbook can be wrong for reasons that are not in the SQL. Always reconcile once.
Row count.
SELECT COUNT(*)against the workbook's row count (filter the key column in Excel and read the status bar). A difference means the extension stopped at an empty row, read a range, or the sheet has more rows than you think.Control total.
SELECT SUM(amount)against=SUM(...)in Excel. If they differ, some cells were read as text or null.Distinct keys.
COUNT(DISTINCT order_no)against the number of unique orders.Date range.
MIN(order_date)andMAX(order_date)should be what you expect. A date read as a number or a date system shift shows here.Types.
DESCRIBEshows them. Compare with what each column should be.
Hidden rows are read like any other: DuckDB sees the cells, not the filter state. If Excel's filtered total differs from the query, look for hidden or filtered rows. Cached formula values are read, not recomputed, so a stale cache gives stale numbers. Merged cells arrive as a value in the first cell and nulls below (unmerging cells and filling values down).
Speed and size
Parsing xlsx is slow compared with querying. For a workbook of tens of thousands of rows it does not matter. For hundreds of thousands, or a file you will query many times, convert once:
COPY (SELECT * FROM read_xlsx('orders.xlsx', sheet = 'Orders', all_varchar = true))
TO 'orders.parquet' (FORMAT parquet);
Then query read_parquet('orders.parquet'), which is fast and typed. Convert with a streaming tool when the workbook is too large to parse in memory (converting a huge Excel file to CSV or Parquet).
Keep the query with the workbook
The great gain over formulas is that the analysis is text. Save the .sql file beside the workbook, with a comment saying which sheet it expects, the date it was written and what it answers. Put it in version control if the analysis matters. Rerun it on next month's workbook and compare. A query is a record of the logic that a pile of cell formulas is not.
When querying the workbook in place is not enough
The data lives in several workbooks. Read them all with a glob, or load them into one table first (joining two Excel sheets with SQL).
The workbook is a report, not a table. Headers over several lines, subtotals and merged cells need cleaning before SQL makes sense (cleaning Excel data before analysis).
Several people need the result continuously. Load the data into a database and connect Excel to it.
The sheet needs its formulas. DuckDB reads values. If the logic you need is in the formulas, you must translate it (translating Excel formulas into SQL).
See DuckDB's pages on the excel extension and window functions. To convert a small result to JSON, use the CSV to JSON converter.


