Cross Tabs From a CSV With SQL and a Chi Square Check
Build a cross tab of two CSV columns with DuckDB PIVOT, add row totals and percentages, and test with chi-square whether the two columns are really related.
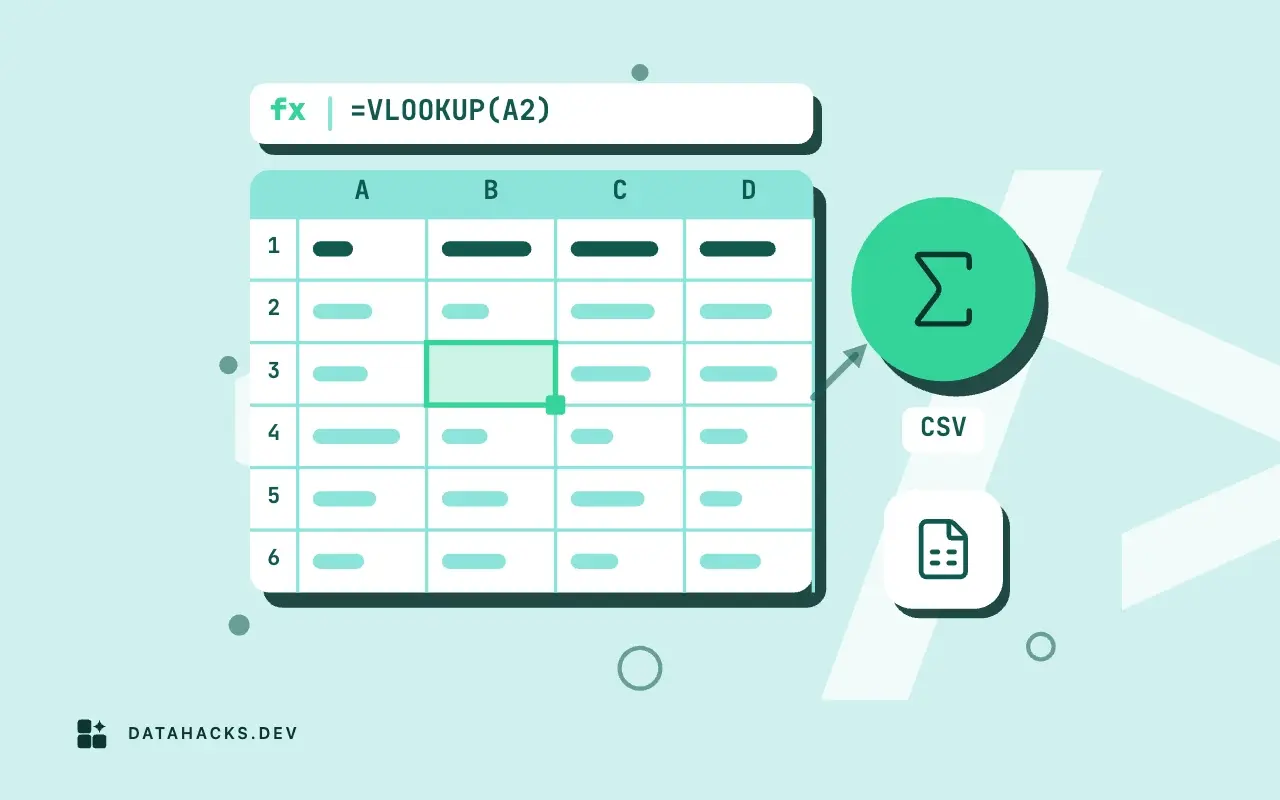
A cross tab, or contingency table, is the first thing to build when you have two categorical columns and want to know whether they have anything to do with each other. Status against country. Plan against churned or not. Browser against checkout failures. It is a grid of counts, with one category down the side and the other across the top, and you read it by eye for the places where the numbers are not what you would expect if the two columns were unrelated. This article builds one with SQL in DuckDB, adds totals and percentages without mixing up the base, and then asks the question the grid cannot answer by itself, which is whether the differences you see are more than noise. It is one of the moves in more analysis moves for CSV data, and a spreadsheet user will recognize it as a pivot table built from a CSV.
The one-line cross tab
DuckDB has a PIVOT statement that turns the distinct values of a column into columns. For a status by country table:
PIVOT (SELECT status, country FROM read_csv('orders-200k.csv'))
ON country USING count(*) GROUP BY status ORDER BY status;status BR DE FR GB IN JP US
failed 5804 5594 5734 5700 5676 5697 5721
paid 5771 5575 5729 5688 5853 5736 5680
pending 5788 5771 5683 5726 5651 5698 5660
refunded 5586 5683 5817 5693 5814 5708 5687
shipped 5689 5797 5820 5729 5811 5516 5715The subquery selects only the two columns you need, ON country names the column whose values become headers, USING count(*) says what to put in each cell and GROUP BY status names the rows. You do not list the countries, which is the point: a new country in next month's file becomes a new column with no change to the query. That convenience has a cost, since the column set is decided when the query runs, so a downstream step that expects a fixed set of columns breaks when the data changes. For a report with fixed columns, list the values explicitly: ON country IN ('BR', 'DE', 'FR', 'GB', 'IN', 'JP', 'US').
Every cell here is near 5,700. With 200,000 orders spread over 35 cells, the expected count is 200,000 divided by 35, or about 5,714, so there is nothing to see. A table with a visible pattern, one cell at double the others, is the case where the grid is useful to the eye.
The same table in any database
PIVOT is not standard SQL. The portable version is conditional aggregation, one expression per column:
SELECT status,
       count(*) FILTER (WHERE country = 'BR') AS br,
       count(*) FILTER (WHERE country = 'DE') AS de,
       count(*) FILTER (WHERE country = 'FR') AS fr,
       count(*) AS total
FROM read_csv('orders-200k.csv')
GROUP BY status ORDER BY status;
FILTER (WHERE ...) works in DuckDB, PostgreSQL and SQLite. MySQL and SQL Server use SUM(CASE WHEN country = 'BR' THEN 1 ELSE 0 END), which does the same thing more loudly. This form lets you control the order and the names of the columns and add a total, and its weakness is that you write one line per value. For a table with a handful of categories, write it by hand; for dozens, generate the SQL from a query of distinct values, or use PIVOT.
Totals and the grand total
Margins, the row and column totals, are part of a cross tab. GROUPING SETS produces them in one statement, with NULL standing for "all" in the grouped columns, which you relabel:
SELECT coalesce(status, 'ALL') AS status, coalesce(country, 'ALL') AS country, count(*) AS n
FROM read_csv('orders-200k.csv')
GROUP BY GROUPING SETS ((status, country), (status), (country), ())
HAVING status = 'failed' OR status IS NULL
ORDER BY status, country;status country n
ALL ALL 200000
ALL BR 28638
ALL DE 28420
...
failed ALL 39926
failed BR 5804
failed DE 5594The row ALL, ALL is the grand total, 200,000, which equals the sum of the countries. Check it against count(*) of the file every time: a margin that does not match the total means rows with a NULL in one of the two columns are being handled differently from what you expect. (A caution: coalesce also relabels real NULLs as ALL, so if your data has missing countries, use GROUPING() to tell the two apart.)
Percentages need a base
Raw counts are hard to compare when the groups differ in size, so cross tabs usually show percentages, and a percentage needs a statement of what it is a percentage of. Three bases are possible and each answers a different question. Row percent divides each cell by its row total and answers "among failed orders, what share came from each country". Column percent divides by the column total and answers "among Brazilian orders, what share failed". Total percent divides by the grand total and answers "what share of all orders were failed Brazilian orders", which is rarely what anyone wants.
In the example, the failed row sums to 39,926, so the Brazilian share of failed orders is 5,804 divided by 39,926, which is 14.5 percent. The Brazilian share of all orders is 28,638 divided by 200,000, or 14.3 percent. Those two being close says that failures are spread across countries like orders are. The comparison of a row percent with the overall percent is the heart of reading a cross tab, and the quickest way to see it is to print both. A column-percent table that is the same in every column is a table in which the rows and columns are independent.
Is the pattern more than chance?
A grid of numbers almost never looks perfectly uniform, and the eye is good at seeing patterns in noise. The chi-square test of independence puts a number on it. It compares each observed count with the count expected if the two columns were unrelated, which is the row total times the column total divided by the grand total, and adds up the squared differences relative to the expected values. In Python with SciPy:
from scipy import stats
chi2, p, dof, expected = stats.chi2_contingency(table)   # table is the 5 x 7 array of counts
print(f"chi2={chi2:.1f} dof={dof} p={p:.3f}")chi2=26.9 dof=24 p=0.308The degrees of freedom are (5 rows minus 1) times (7 columns minus 1), which is 24. The statistic 26.9 is close to what you expect by chance when there are 24 degrees of freedom (the average of the distribution is 24), and the p-value of 0.31 says that if status and country were unrelated, a table at least this uneven would appear about 31 percent of the time. The sensible reading is that the data give no evidence of a relationship, and with this sample the data were generated without one.
A small p-value, below about 0.01, means the table is hard to explain by chance and tells you the columns are related, and it says nothing about how strongly or in what direction. For that, look at which cells contribute most to the statistic (the standardized residuals, observed minus expected over the square root of expected) and at the percentages. And with 200,000 rows, almost any real-world relationship, however tiny, becomes statistically significant, so also ask whether the difference matters in practice, not only whether it is detectable.
What breaks the test
The chi-square approximation needs enough rows in each cell: the usual rule is that expected counts should be at least 5, in nearly all of the cells. A cross tab of 20 categories by 20 categories on a thousand rows has many cells with 2 or 3 expected, and the p-value is unreliable. The fixes are to merge rare categories into "other", to use a test designed for sparse tables (Fisher's exact test for 2 by 2 tables) or to simulate the null distribution. The test also assumes that rows are independent: a table of orders in which one customer placed a hundred of them violates it, and the p-value is overstated.
And watch for the paradox that appears when a third column drives both: a cross tab of status and country over all time can hide a pattern that appears within each month (more analysis moves for CSV data shows a small case). If you suspect that, add the third column as a filter or a further dimension.
When a cross tab is the wrong summary
A cross tab suits two categorical columns with a modest number of values. It is the wrong summary for a numeric column, which needs to be bucketed first and loses information in the process (use a histogram, or compare distributions with percentiles per group). It is the wrong summary when one of the columns has hundreds of values, because the grid is unreadable and sparse, and a ranked list of the largest cells serves better. It is the wrong summary for time, where a line over the dates shows what a grid of months cannot (comparing two time periods in a CSV).
For the per-group totals that sit behind a table like this one, see grouping and aggregating CSV data in DuckDB and building a frequency table from a CSV column. The statement is documented in DuckDB's PIVOT reference, and the test in SciPy's chi2_contingency page.